This article will get you started with how to enable miniprofiler in ASP.NET Core to measure the performance of your application. MiniProlifer helps you understand how your application is performing by allowing you to profile any part of code in ASP.NET Core Applications.
Table of Contents
Need for Profiling
It is very obvious for every application developer to wonder about how their application is performing in the production environment and always there will be a requirement for code/application to perform better i.e. operations should be fast.
Code profiling will provide details about code performance and if any code/function is running slow i.e. taking more than expected time then you will have to identify where this code/function is spending most of the time i.e. you need to know which block of code is running slow so that you can optimize that piece of code.
Code profilers allow us to easily, without significant efforts (code changes or configuration), capture this information about where the application is spending most of the time.
If something is not performing correctly then steps can be taken to correct that with the help of profiling.
What is MiniProfiler
MiniProfiler is a simple but effective mini-profiler for .NET, Ruby, Go, and Node.js.
MiniProfiler is a simple, easy to use & light-weight profiler that can be used in ASP.NET Core applications to analyze where code is spending most of the time.
Minifprofiler in ASP.NET Core puts the profiling data right on the webpage of your application which makes it easy to access. Access to this data from miniprofiler can be controlled based on user/user roles.
Getting Started with MiniProfiler in ASP.NET Core
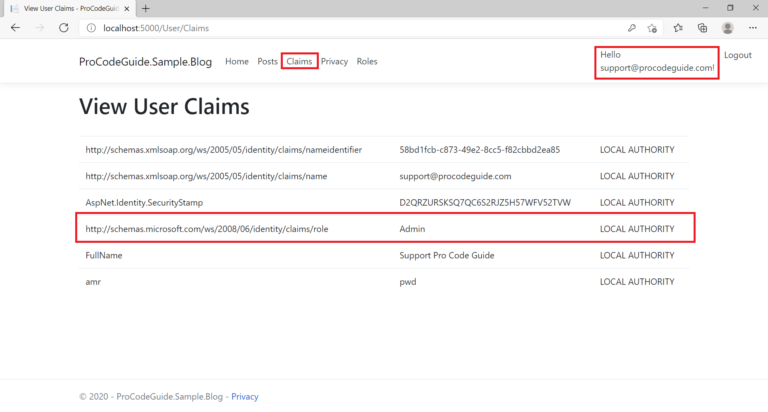
We will be using one of my previous asp.net core projects which I had developed as part of the article ASP.NET Core Identity Claims based Authorization. Here is the GitHub link to download the source code for our initial project for the demonstration of MiniProfiler in ASP.NET Core.
https://github.com/procodeguide/Samples.Identity.Claims
After downloading the above project you will have to perform Add Migrations & update database to the project, in Visual Studio, by running the below commands in the package manager console.
add-migration FirstMigration
update-database
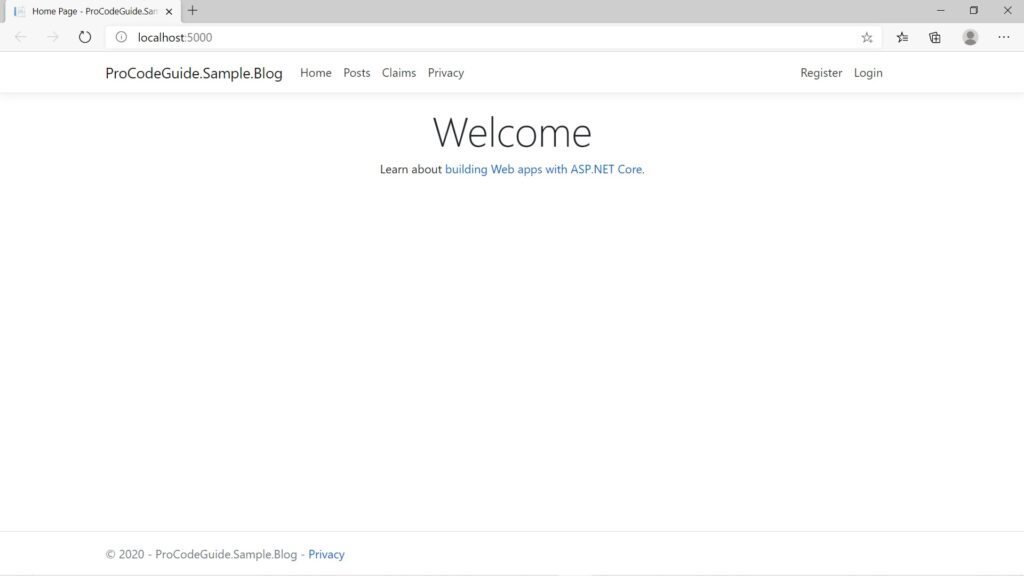
After running the above commands run the project and you should see the below screen.
Adding MiniProfiler to your application
Here we will enable miniprofiler in ASP.NET Core for the application which we have downloaded and initialized as part of the previous section. You first need to install a miniprofiler to the application using the Nuget Package Manager. Run the below mentioned commands in Package Manager or install required Nuget packages from Nuget Package Manager. We will be installing all the packages required for the entire article.
Install MiniProfiler in ASP.NET Core
Install-Package MiniProfiler.AspNetCore
Install-Package MiniProfiler.AspNetCore.Mvc
Install-Package MiniProfiler.EntityFrameworkCore
Configure MiniProfiler in ASP.NET Core in Startup.cs file
Configure MiniProfiler in the project by adding the following code to ConfigureServices & Configure method in a startup.cs file
public class Startup
{
	public Startup(IConfiguration configuration)
	{
		Configuration = configuration;
	}

	public IConfiguration Configuration { get; }

	// This method gets called by the runtime. Use this method to add services to the container.
	public void ConfigureServices(IServiceCollection services)
	{
		//Remaining code has been removed for readability. Full code is available for download below

		services.AddMiniProfiler(options =>
		{
			options.PopupRenderPosition = StackExchange.Profiling.RenderPosition.BottomLeft;
			options.PopupShowTimeWithChildren = true;
		});
	}

	// This method gets called by the runtime. Use this method to configure the HTTP request pipeline.
	public void Configure(IApplicationBuilder app, IWebHostEnvironment env)
	{
		//Remaining code has been removed for readability. Full code is available for download below

		app.UseMiniProfiler();
	}
}
Configure MiniProfiler in view components
Add the following line in _ViewImports.cshtml
@using StackExchange.Profiling
@addTagHelper *, MiniProfiler.AspNetCore.Mvc
@*Remaining code has been removed for readability. Full code is available for download below*@
This will import all the tag helpers that are found in the assembly MiniProfiler.AspNetCore.Mvc
We will add the MiniProfiler tag to _Layouts.cshtml page so that it displays data on every page of the application. Add the below-mentioned tag in _Layouts.cshtml
<mini-profiler />
@*Remaining code has been removed for readability. Full code is available for download below*@
Now after running the application we should start getting default data from MiniProfiler in ASP.NET Core. Let’s run & view the data.
View default data from MiniProfiler in ASP.NET Core Web Application
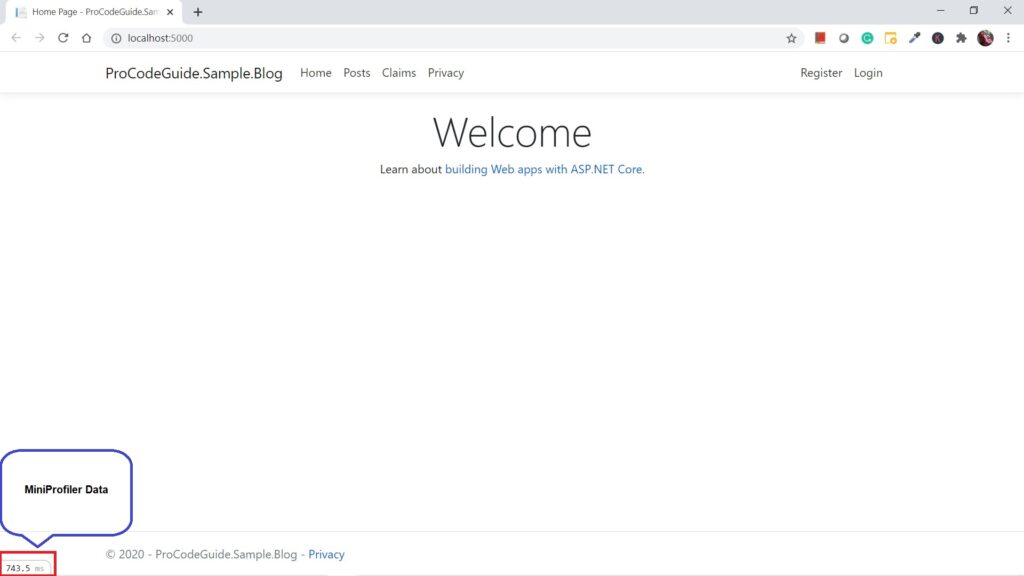
The above screen shows the miniprofiler data which displays the total time taken to load the screen. On clicking on the above-displayed number it will further display details of the code execution timings as shown below
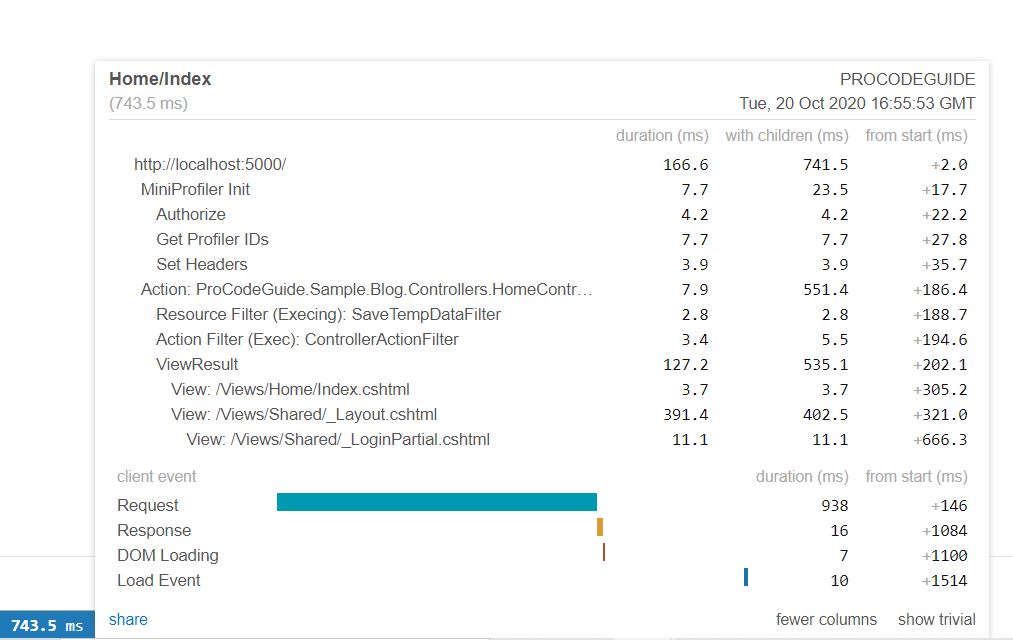
On the above screen, you can see it displays default details i.e. time spent in the controller and time spent to render the view for the request http://localhost:5000/. From these details, we come to know where code is spending most of the time.
This way you can navigate to the required URL and analyze the time-taken along with the breakup of the total time taken by the request.
Enabling profiling for Entity Framework Core SQLs
MiniProfiler in ASP.NET Core can even track & provide data for all the SQL that are running in your ASP.NET Core application. Here we will enable MiniProfiler in ASP.NET Core application using Entity Framework Core in the data access layer.
We have already installed the required NuGet package i.e. MiniProfiler.EntityFrameworkCore
Now we need to add an additional method call in the ConfigureServices method in the Startup.cs file. Here is the modified for ConfigureServices method
public void ConfigureServices(IServiceCollection services)
{
	//Remaining code has been removed for readability. Full code is available for download below

	services.AddMiniProfiler(options =>
	{
		options.PopupRenderPosition = StackExchange.Profiling.RenderPosition.BottomLeft;
		options.PopupShowTimeWithChildren = true;
	}).AddEntityFramework();
}
Now that we have enabled profiling for Entity Framework core let’s run the code & check the data being displayed by MiniProfiler in ASP.NET Core. After running the application & clicking on details for MiniProfiler data following data is displayed.
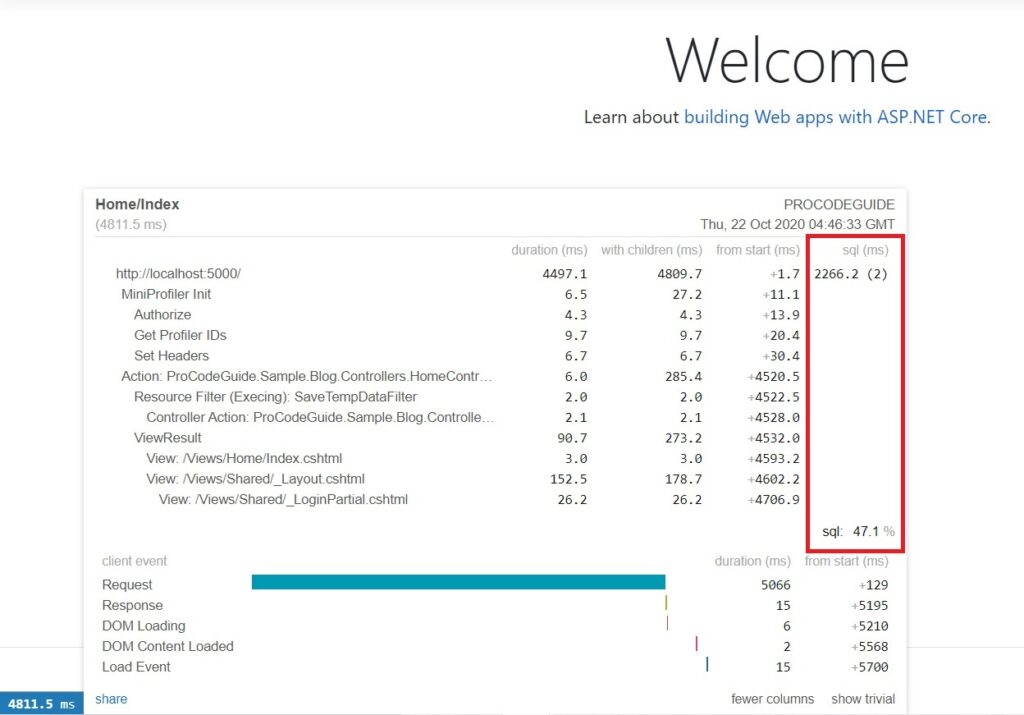
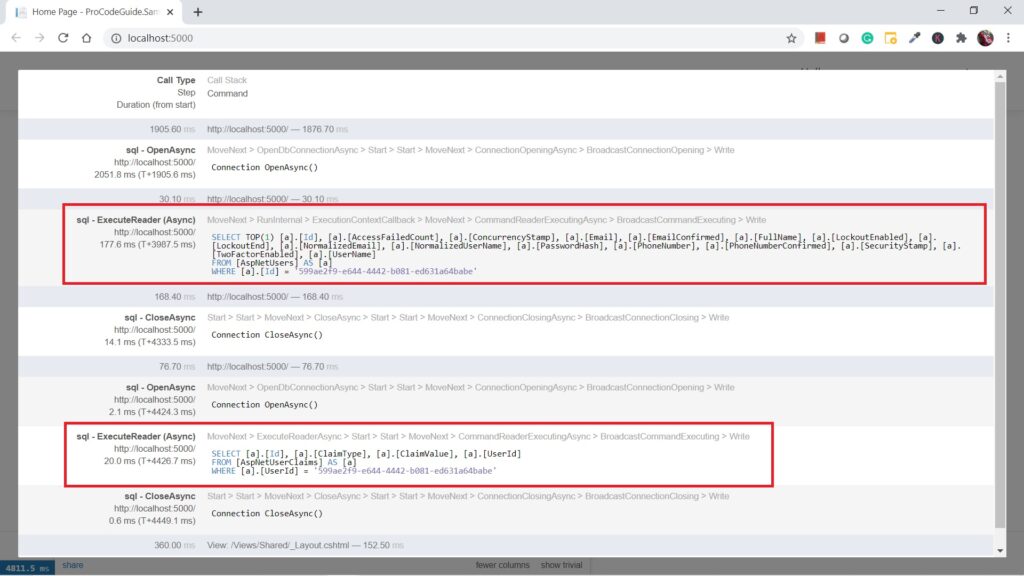
As you can see in the above screen one extra column is added to the data with the name sql, it displays the time taken by sql statement and within brackets is the number of sql executed. After clicking on the number displayed in the SQL column details for SQL will be available as shown below.
Enabling profiling for your custom code block
Here we will see how to track the performance of a specific block of code like some calculation or processing.
We have already installed the required NuGet package i.e. MiniProfiler.AspNetCore. We will make use of the Step function from MiniProfiler to measure the time taken for a specific block of code.
Step function starts a new timer for the specified block of code & Step function takes description as input that will be displayed in data from MiniProfiler.
For demonstration purposes, I have added the below code in the Details action of the Posts Controller.
public IActionResult Details(string id)
{
	Post post = null;
	using (MiniProfiler.Current.Step("Load Posts & Find Specific Post"))
	{
		post = DataHelper.GetAllPosts().Find(p => p.Id.Equals(id));
	}
	return View(post);
}
Now that we have added profiling for a custom block of code let’s run the code & check the data being displayed by MiniProfiler. After running the application navigate to Posts-Details actions & clicking on details for MiniProfiler data following data is displayed.
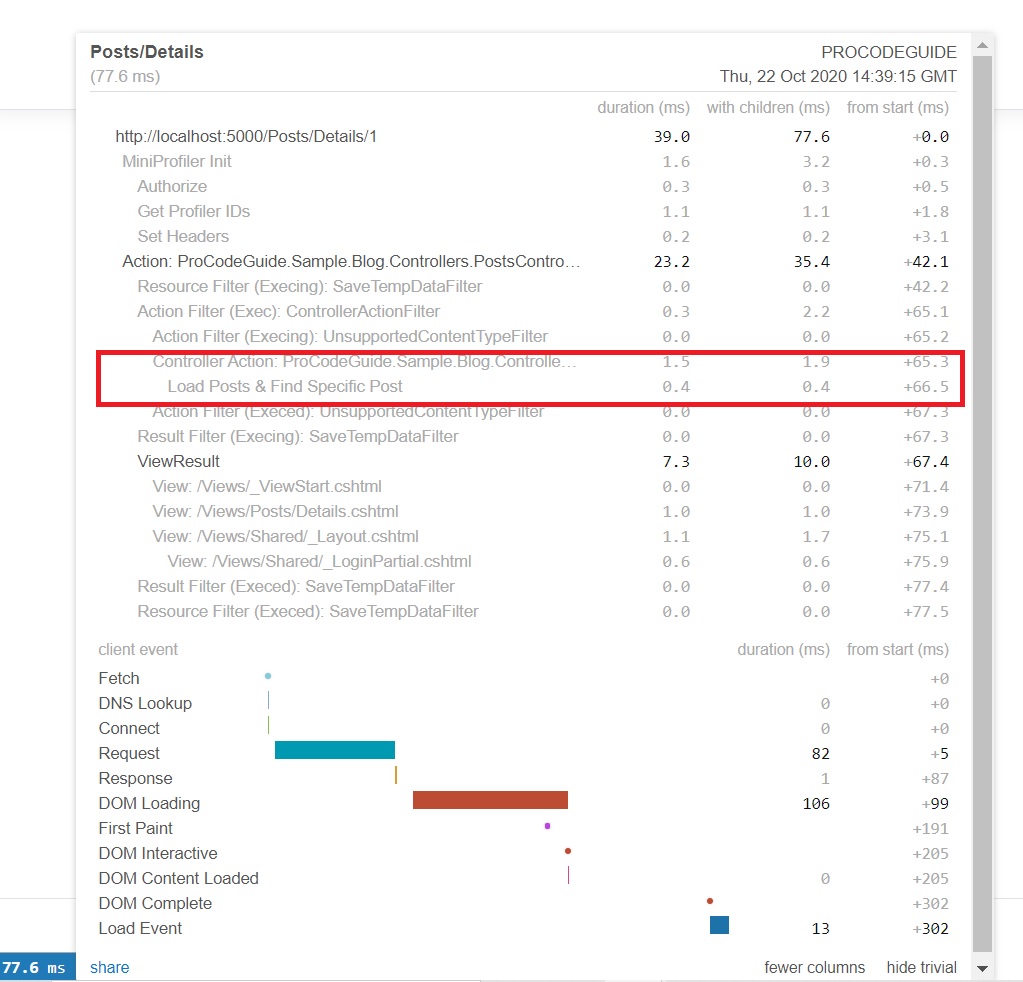
As you can see in above screen one extra row for the post-details request is added with timings & description from custom block code profiling.
Enabling profiling for ADO.NET queries
This is for applications that don’t use Entity Framework Core i.e. using ADO.NET in data access layer.
We have already installed the required NuGet package i.e. StackExchange.Profiling
You will have to use ProfiledDbConnection class from StackExchange.Profiling namespace & its constructor take the connection string as input.
For demonstration purposes, I have added the below code in the GetAllPosts method in ProCodeGuide.Sample.Blog.Helpers.DataHelper class. (Please note that the below code is commented in source code & if you want to run this code then you need to create Posts table in the database with columns Id, Title, Description & CreatedOn)
using (SqlConnection connection = new SqlConnection(@"Data Source=(localdb)\MSSQLLocalDB;Database=ProCodeGuide.Sample.Blog;Trusted_Connection=True;MultipleActiveResultSets=true"))
{
	using (ProfiledDbConnection profiledDbConnection = new ProfiledDbConnection(connection, MiniProfiler.Current))
	{
		if (profiledDbConnection.State != System.Data.ConnectionState.Open)
			profiledDbConnection.Open();
		using (SqlCommand command = new SqlCommand
		 ("Select * From Posts", connection))
		{
			using (ProfiledDbCommand profiledDbCommand =
			  new ProfiledDbCommand(command, connection,
				MiniProfiler.Current))
			{
				var data =
				 profiledDbCommand.ExecuteReader();
				//Write code here to populate the list of Posts
			}
		}
	}
}
Now that we have added profiling for an ADO.NET SQL let’s run the code & check the data being displayed by MiniProfiler. After running the application navigate to the posts link & clicking on details for MiniProfiler data following data is displayed.
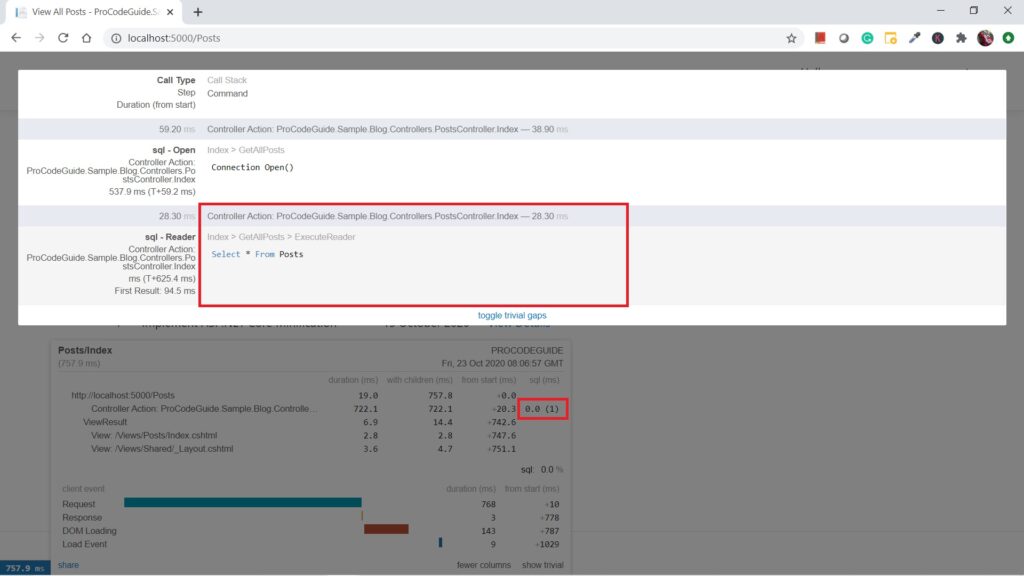
As you can see in above screen that sql details from ADO.NET is being displayed as part of MiniProfiler data.
How to secure MiniProfiler data
As you have seen in that MiniProfiler provides lots of useful data & this data is available by default for all the users without any restrictions. Now if you want to restrict access to data only for developers or architects then that can be done.
Also it provides lots of code details like functions names, SQLs, etc. which you don’t want end users to see.
You can use the below code to restrict access to data to a particular user or user role.
services.AddMiniProfiler(options =>
{
	options.PopupRenderPosition = StackExchange.Profiling.RenderPosition.BottomLeft;
	options.PopupShowTimeWithChildren = true;
	options.ResultsAuthorize = (request) => request.HttpContext.User.IsInRole("Developer");
	options.UserIdProvider = (request) => request.HttpContext.User.Identity.Name;
}).AddEntityFramework();
This allows you to enable MiniProfiler in your production environment without exposing data to the end-users.
Summary
In this article, we saw how to profile your code using MiniProfiler in ASP.NET Core to analyze where code is spending most of the time. This can be used to optimize your code.
We were able to configure MiniProfiler without much efforts & also detailed default data was available out of the box.
Download Source Code
Here is the source for download
https://github.com/procodeguide/MiniProfiler.Sample
-
What is Code Profiling?
Code profiling will provide details about code performance and if any code/function is running slow
-
What is MiniProfiler?
MiniProfiler is a simple, easy to use & light-weight profiler that can be used in ASP.NET Core applications to analyze where code is spending most of the time.
Hope you found this article useful. Please support the Author

