Looking to analyze ASP.NET Application issues then here is an article which talks about where you need to look. Most of the time you will be able to analyze asp.net related application issues using the below-mentioned techniques.
Table of Contents
IIS Logs
First make sure that you have enabled IIS logs, configured path for IIS logs, and are logging all the important/required fields for analysis. I personally prefer to select all the fields for the log. In case you need help on how to configure IIS logs then you can check this article on how to configure IIS Logs. IIS logs will typically contain a single entry for each request to the site which contains the date/time of the request, URL, query-string, response status with sub status, time-taken, and many more fields that provides details of each request. Refer here for a complete list of W3C log fields.
Error codes, in case of error, are available in status substatus and win32 status which can help identify the details of the error. Status is normal HTTP response codes like 200 means ok, 404 – not found, 500 – Internal server error mostly refers to application error (complete list of HTTP response status codes), etc. sc-win32-status can provide more details about the underlying error. IIS Logs helps to analyze asp.net application issues like failing requests, slow requests, etc.
Also, the Log Parser tool from Microsoft can be used to read and analyze IIS logs. Download Log Parser 2.2
HTTPERR Logs
You should be able to locate your request in IIS logs but in case even after enabling your IIS logs your request is not present in IIS logs then there is a possibility that the request never reached IIS so you need to also look in HTTPERR logs. Any incoming request to the webserver is first handled by HTTP.SYS before being routed to the IIS worker process. Some requests are rejected by HTTP.SYS before being passed to an IIS worker process for handling. This generally happens in case of errors like Bad Request (400), connection timeouts, service unavailable (503), and many more. Here is the complete list of HTTP.SYS error codes.
HTTPERR logs help to Analyze ASP.NET Application Issues by providing details of an error at the request level which helps in identifying issues at each request level.
HTTPERR logs can be found on path C:\Windows\System32\LogFiles\HTTPERR
Windows Event Logs
Request in IIS logs with status 500 i.e. Internal server error is mostly related to unhandled ASP.NET Application errors. If configured properly and if there are no compatibility issues with the health monitoring feature then, in that case, there are chances that error details might have been logged to the windows event log. Health Monitoring will log all errors to the application event log. Specifically, look for warning events from the source “ASP.NET “. One point to note here is that errors written to EventLog are limited i.e. it will only log one error per minute.
Also, it will be helpful to scan event logs around the error time to get some insights if there are any other errors/warnings related to Windows/Disk/CPU/Memory which might be causing an error in the Application.
Failed Request Tracing
This will help you capture a detailed request trace for a specific URL, status code or time-taken. Will provide details to determine what is happening with request and why, provided the problem can be simulated. Problems that are random in nature are difficult to troubleshoot unless you are able to capture trace when the problem occurs.
Request trace is very detailed and sometimes it might take lots of time to analyze a single request.
Display ASP.NET Exception
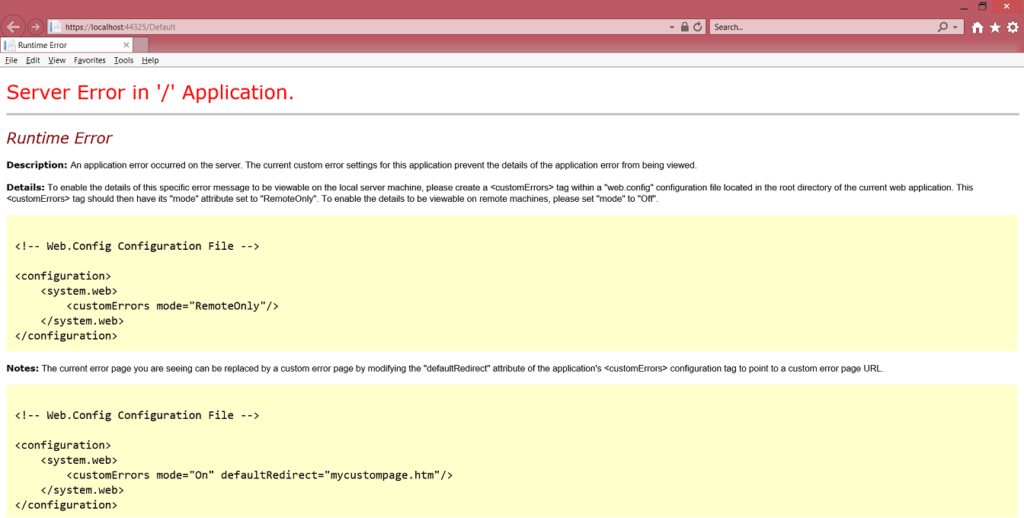
On a temporary basis, you can enable your application to display a complete exception in the browser to identify the exact cause of the problem.
For this, we can need to add a customErrors tag within the web.config configuration file located in the root directory of the application. The <customErrors> tag should have its mode attribute set to off. ‘off’ Specifies that custom errors are disabled & detailed ASP.NET errors are shown to the remote clients and to the localhost.
<customErrors defaultRedirect="url" mode="On|Off|RemoteOnly">
    <error. . ./>
</customErrors>
Remember that this setting i.e. custom errors should always be set to mode ‘on’ & should be enabled for debugging purposes only.
DebugDiag for Crash/Hang, Memory & Performance Analysis
To Analyze ASP.NET Application Issues DebugDiag can be used. DebugDiag is a free tool from Microsoft with capability that allows us to collect & analyze memory dump files. Dumps can be generated in 2 ways i.e. conditional or on-demand collections of memory dump files using configurable rules that trigger the collection.
DebugDiag download link: https://www.microsoft.com/en-us/download/details.aspx?id=58210
To a collect memory dump file on-demand
- Run the DebugDiag 2.3 Collection tool.
- Go to the Processes tab, Identify the process (e.g. using process ID) which needs to be analyzed.
- Right-click on the required process and select the Create Full Userdump option from Menu.
To analyze the memory dump file
- Run DebugDiag Analysis tool
- Click add data files and add dump files which need to be analyzed.
- Under analysis select type of analysis required and click start analysis.
- It will generate a Report (mht file) that can be reviewed for details.
Conclusion
We reviewed various techniques to analyze asp.net application issues & these techniques have personally helped me to resolve many ASP.NET web application related issues. DebugDiag has been a great help to identify issues such as the hang process.
Hope you found this article useful. Please support the Author

